Thanks.
** I've updated the GROK filter in a separate post as formatting requirements have evolved with the release of the 5.4 stack.
- Background
I run a parallel site on blogger (http://scom-2012.blogspot.com/) that deals with monitoring and alerting for Windows hosts.
I recently moved to a new position with a different company and my duties have shifted from monitoring and alerting to event correlation and automation in support of DevOps.
I'm basically a fish out of water when dealing with the ELK stack and Linux, but have never backed down from a challenge or new learning experience. So in this first installment, I'll walk through how I setup Filebeats on a windows host to ship IIS logs to a Linux based ELK stack.
I found a lot of tantalizingly close examples on the Internet, but none that gave the whole solution, soup to nuts, and so I figured it would be good to get a log of these types of things as a newbie, as many of you out there may be.
You might also be an experienced Linux admin suddenly having to index events from windows hosts and wondering what the hell to tell your windows guys what they need to do.
My primary perspective is as a Windows admin with little to no Linux experience.
- The Problem: Getting IIS logs to logstash and properly indexed.
**Note** The configuration used for this walkthrough is based on the initial setup walk-through from How To Install Elasticsearch, Logstash, and Kibana (ELK Stack) on Ubuntu 14.04 and presumes you have a functional ELK setup or at least created a new one based on the DigitalOcean guide.
The first step is to get a filter configured in LogStash in order to properly receive and parse the IIS logs.
Here is the filter I came up with:
11-iis-filter.conf
**Note** What this filter is doing first is saying, "I'm looking for information coming in that is typed or tagged as iis". If you open an IIS log, you'll notice a lot of header and logfile identifying information you don't care about and can't be parsed in the same manner. So the next section in the file is basically saying, "If a line starts with #, skip it". Finally, a Grok sudo regex filter is put in place in order to identify all the fields for each line logged in IIS, the real data in the log that needs to be captured and indexed.
filter {
if [type] == "iis" {
if [message] =~ "^#" {
drop {}
}
grok {
match => { "message" => "%{DATESTAMP:Event_Time} %{WORD:site_name} %{HOSTNAME:host_name} %{IP:host_ip} %{URIPROTO:method} %{URIPATH:uri_target} (?:%{NOTSPACE:uri_query}|-) %{NUMBER:port} (?:%{WORD:username}|-) %{IP:client_ip} %{NOTSPACE:http_version} %{NOTSPACE:user_agent} (?:%{NOTSPACE:cookie}|-) (?:%{NOTSPACE:referer}|-) (?:%{HOSTNAME:host}|-) %{NUMBER:status} %{NUMBER:substatus} %{NUMBER:win32_status} %{NUMBER:bytes_received} %{NUMBER:bytes_sent} %{NUMBER:time_taken}"}
}
}
}
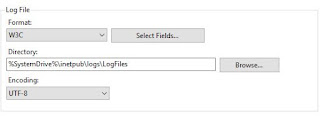
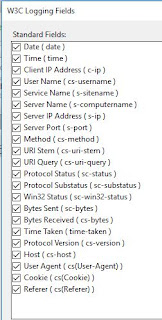
This filter is compatible with the following settings found in IIS as follows (if you choose fewer fields, you may have to prune the information in the filter):
There are a few ways to get the file created in Logstash. The first method is similar to the approach in the DigitalOcean tutorial. The second method is to create the file on your workstation and WinSCP the file over to the ELK server. A third method is to run
"curl -L -O https://github.com/elk-stack/elk/blob/master/11-iis-filter.conf" from the /etc/logstash/conf.d directory on the ELK server. I setup a github project for assisting with ELK stack build-out here: https://github.com/elk-stack
Linux console method:
- SSH to your ELK system via something like Putty
- type in "cd /etc/logstash/conf.d"
- type in "sudo vi 11-iis-filter.conf"
- Copy the contents of the sample 11-iis-filter.conf file into the editor (for a blank file, I found it useful to hit the insert key, then tap the enter key a couple times before pasting the contents into putty).
- You should now have a screen that looks like the following:
- Press the esc key, then :wq! to exit the editor
- Now, type in "sudo service logstash restart"
On my windows host, I created a directory called ELK (for the purposes of this walkthrough).
Use the instructions found here to get Filebeats running on your Windows Host- https://www.elastic.co/guide/en/beats/filebeat/current/filebeat-installation.html
Due to issues of duplicate log file entries, the method to ensure the least amount of headache is to set logging at the server level in IIS, not for individual sites. This way, you can ensure logs are uniquely indexed in Logstash.
Wherever you ended up placing the Filebeat install, you should have a directory structure similar to the following:

There was a section that created a certificate for the ELK server in the Digital Ocean walkthrough. That certificate will have to get copied to the workstation in order to secure the connection and pass data.
Start by opening a WinSCP connection to the ELK host and browse to the certificate directory.
With the certificate in place on the local workstation, the "yml" file needs to be modified to use the new filter information.
As shown in the video, take the following steps to get the certificate to the workstation
- Open WinSCP and connect to the ELK host
- On the ELK server, browse to /etc/pki/tls/certs
- On the workstation, browse to your filebeat installation directory
- Copy the logstash-forwarder.crt to the Filebeat Directory or the ELK directory
On a Windows 2012 or Windows 10 system, simply double-click the certificate, select local machine for the store location, and then choose the option to "Place all certificates in the following store" and choose "Trusted Root Certification Authorities"
Before proceeding to the configuration file, this is what the structure of my C:\ELK directory looks like at this point.
Go back into the Filebeat directory where the application was installed to and edit the filebeat.yml file with notepad or notepad++
The first section to edit will be labeled "Prospectors"
There will be default or "out of the box" entries in this section as follows:
- paths:
- /var/log/*.log
Since this is a windows host, delete or comment out the /var/log entry
Replace that with:
**Note** validate the naming of the logfiles and their location on your system and adjust as necessary
- C:\inetpub\logs\LogFiles\W3SVC1\u_ex*
document_type: iis
This statement matches the type with the filter that was created in logstash earlier.
Next, look for the field labeled as "input_type:" and change to "log" (without quotes)
Continue down into the file and exclude the options under "### Elasticsearch as output"
After removing the Elasticsearch output, look for the Logstash section. Here you'll want ensure the entry is uncommented. By default, the section is not active.
After entering the host information, proceed to the "tls:" option, uncomment the section and add an entry as follows:
tls:
# List of root certificates for HTTPS server verifications
certificate_authorities: ["C:\\Elk\\logstash-forwarder.crt"]
If the Filebeat service isn't started, go ahead and run "net start filebeat" from an administrative command prompt, otherwise, restart the service or stop and start it again from the command prompt.
- Progress Check
With the steps taken to this point, here is what has been accomplished:
- IIS server (not site) has been set to maximum logging
- Logstash has been setup with a filter of type IIS to be received by a Filebeat client on a windows host
- The Filebeat client has been installed and configured to ship logs to the ELK server, via the Filebeat input mechanism
On the web server, hit the site(s) hosted a few times from a workstation, or even locally to generate logs.
Next, SSH into the ELK system and run the following command to check for information that should have been logged:
curl -XGET 'http://localhost:9200/filebeat-*/_search?pretty'
Look for results that say something like "source" : "C:\\inetpub\\logs\\Logsfiles\\...." or wherever you have configured the logfiles to reside.
Now, open Kibana -> select Settings -> select the Filebeat index -> choose Refresh Field List -> choose Set as Default Index
If all has gone well, you should now be seeing indexed, IIS logs from your system which look similar to the following:
Expand the log to inspect the "tags" element. This will indicate whether the logs are being successfully parsed, or if the grok filter is not applying correctly. Ideally, you would see "beats_input_codec_plain_applied". Otherwise, you may see a Grok parser error as well, which indicates the fields being logged are not mapped correctly to the filter or some other issue. If all steps were completed successfully, errors should not occur.


Dave, good stuff!
ReplyDeleteQuestion about tagging/fields for filebeat. If you have multiple sites on a single IIS server, how do you know which site the log entry came from? You mention 'set logging at the server level in IIS', but to me it seems like you'd still not have any kind of 'applicationName' or 'siteName' tag/field to tell you 'hay this is a log entry from myAppName or yourAppName'. e.g. I'm in Kibana and want to see all IIS logs for myAppName. How do you filter for that?
I am right now looking at adding fields in the prospector definition, and then having multiple prospectors - one per site. Feels like that's a bad way to do it...but not seeing any other methods.
Perhaps I'm missing something fundamental? Appreciate any input!
If you capture all the fields, it should log the server and URLs accessed (s-computername), e.g. SERVER1, SERVER2, SERVER3 and the (cs-uri-query) would indicate the site it came from, but if you wanted to be more specific, instead of a general IIS document type/index, you could setup individual folders for each site on the IIS system, give the document type in the yml file a specific header for each site and a corresponding filter in logstash. So instead of - C:\inetpub\logs\LogFiles\W3SVC1\u_ex*
Deletedocument_type: iis
It might look like:
- C:\inetpub\logs\LogFiles\W3SVC1\SiteA\u_ex*
document_type: iis-SiteA
- C:\inetpub\logs\LogFiles\W3SVC1\SiteB\u_ex*
document_type: iis-SiteB